So, what should you focus on so that everything's not in vain? Here are some areas that we find crucial:
Establishing Goals
Whether you’re looking to increase sales, improve engagement, or expand your reach you need to **establish clear objectives and use them to guide your decisions throughout the first year.** By identifying your key performance indicators (KPIs), you can measure your progress and make necessary adjustments.

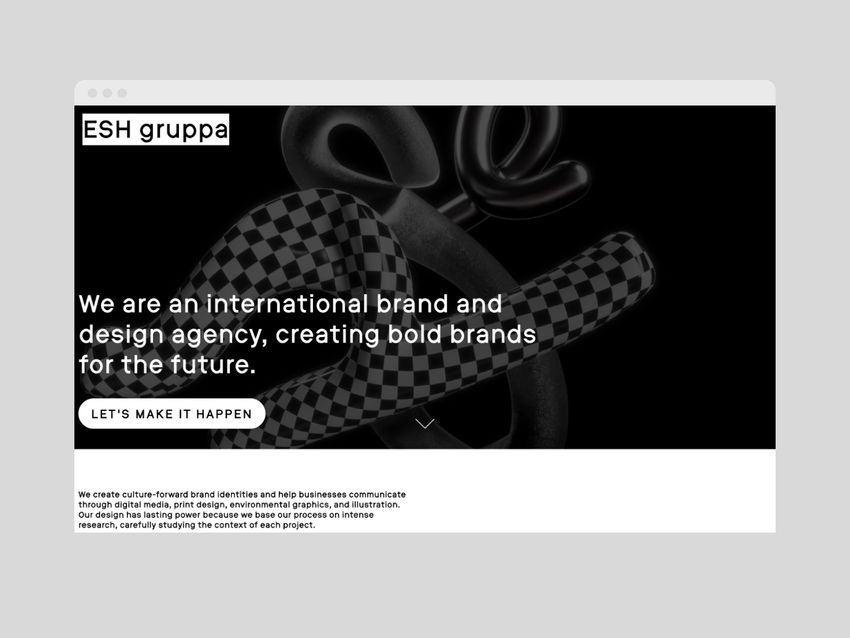
We released our website in 2018 and in 2022 began constructing upgrades with the goal of venturing into the international market as well as being more visible, accessible and transparent.
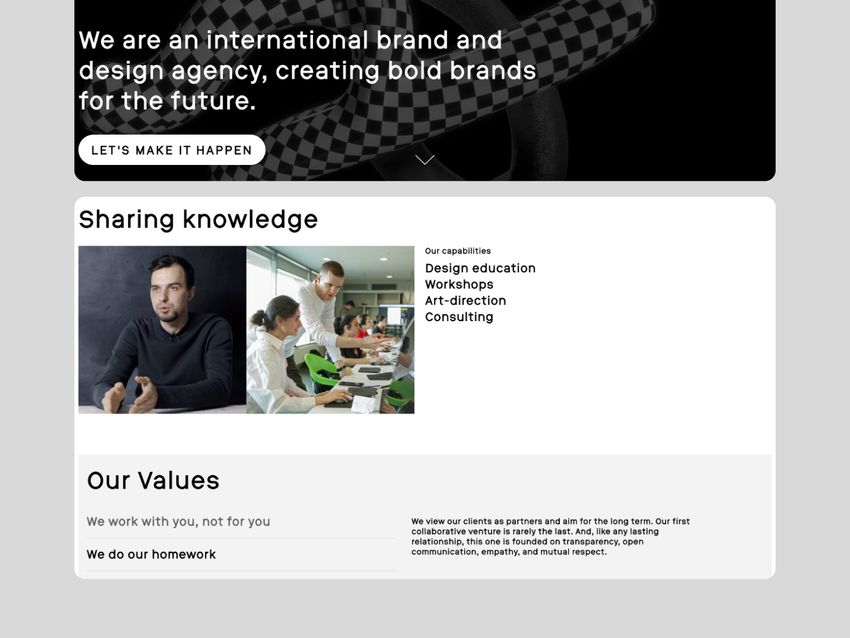
We took a hard look at our website and identified the areas where we fell short. For instance, we revamped our home page, ditching the generic project names in favor of more detailed, clear, and attention-grabbing titles. Now, the users and our potential customers won't be left guessing what our projects are all about.
This extends beyond copywriting. We had to reconfigure the entire “about” page, both in structure and design. We wanted the new version to really represent who we are as a company and attract like-minded collaborators. That's why we used prototyping to test out various approaches to the mechanics and figure out the perfect form.
Throughout this evaluation process, it was essential to remain critical and focused on the ultimate goal. This can be tough, especially when the project is close to your heart.
Tracking Analytics
Install an analytics tool like Google Analytics to gather valuable data on the behavior of your visitors and help you get a picture of your traffic sources. It will give you insights on how users interact with your site, which pages have the highest bounce rate, and how long users stay on your website. This data can help you identify areas for improvement and prioritize your efforts.
For the updated version of the ESH gruppa website, we use umami. It has a clear interface, lacks unnecessary tools, and doesn't transfer personal data of our users to corporations.
In about a month post-launch you can start analyzing metrics. Use them to identify weak spots in your design and optimize user experience for better engagement.
Look for the most visited pages.
In our case, these are our projects presented on the main page. It has a stories-like format, auto-playing through the previews linking to full pages. The first three screens have the most click-throughs. What could we do with this info? For example, we could decide to cut the number of screens to optimize the load time.
See where the users come from.
That's how you determine which source of traffic is the most effective in achieving your goals. At the moment we use articles, blog posts, and social media. They direct users to our website, and metrics show us which kinds of publications work best.
Track advertisement effectiveness.
With the right metrics, you can find out if your ads are actually working. For example, if we're looking to drive traffic to our website, we launch paid posts on Twitter, Dribble, and LinkedIn. Then, by monitoring the number of clicks on our page, we can figure out which platforms are working best.
It's all about being smart with your data and making the necessary adjustments based on what you find. But remember, daily checking of the metrics is not necessary — once a month is enough to get an adequate picture. So go ahead and get tracking.Install an analytics tool like Google Analytics to gather valuable data on the behavior of your visitors and help you get a picture of your traffic sources. It will give you insights on how users interact with your site, which pages have the highest bounce rate, and how long users stay on your website. This data can help you identify areas for improvement and prioritize your efforts.
For the updated version of the ESH gruppa website, we use umami. It has a clear interface, lacks unnecessary tools, and doesn't transfer personal data of our users to corporations.
In about a month post-launch you can start analyzing metrics. Use them to identify weak spots in your design and optimize user experience for better engagement.
Look for the most visited pages.
In our case, these are our projects presented on the main page. It has a stories-like format, auto-playing through the previews linking to full pages. The first three screens have the most click-throughs. What could we do with this info? For example, we could decide to cut the number of screens to optimize the load time.
See where the users come from.
That's how you determine which source of traffic is the most effective in achieving your goals. At the moment we use articles, blog posts, and social media. They direct users to our website, and metrics show us which kinds of publications work best.
Track advertisement effectiveness.
With the right metrics, you can find out if your ads are actually working. For example, if we're looking to drive traffic to our website, we launch paid posts on Twitter, Dribble, and LinkedIn. Then, by monitoring the number of clicks on our page, we can figure out which platforms are working best.
It's all about being smart with your data and making the necessary adjustments based on what you find. But remember, daily checking of the metrics is not necessary — once a month is enough to get an adequate picture. So go ahead and get tracking.
Technical Characteristics
Let's talk web performance. Is your website fast and reliable? Is it optimized for mobile devices? Are there any bugs? Regularly check your website's technical aspects such as loading speed, responsiveness, and security. Slow websites and glitches can irritate visitors and sabotage your search engine rankings.
Here’s what we do: we use services that measure how quickly our website loads, the quality of image and font optimization, and other key technical elements. We carefully monitor these characteristics, making sure our website is up to speed. We recommend you do the same. Try this tool to test your website: pagespeed.web.dev.
In the first year, you also may need extra help from developers to keep an eye on broken links and error codes. With proper support, you can make sure no technical errors are hiding in the background and maintain peak performance.
User Feedback
After all technical problems are fixed and traffic flow is stabilized take advantage of surveys, ratings, and comments to gather information on what users like and dislike about your website. This feedback can be used to refine user experience, adjust design elements, and tailor content to better meet the needs of your audience for more satisfied users, and thus, a higher chance of conversions.
For surveys, it’s important to identify user groups. In our case it’s not just visitors, but designers who use the admin panel to upload our projects to our website. By getting their feedback on the difficulties they deal with, we can improve the admin interface. Everyone else is encouraged to fill out this anonymous form.
How difficult is it to navigate our website? (0 - I don't understand how it works at all)(5 - intuitive website)
How hard is it to find the necessary information on our website? (0 - I don't understand how it works at all) (5 - intuitive website), or "I haven't looked for it"
What is the main inconvenience in interacting with the site?
Rate the expressiveness of the design 0-5 (0 - I don't like the design at all)(5 - I like the design a lot)
How memorable is the website? (0 - like any other website, 5 - very memorable)
How often do you visit the ESH gruppa's website?
Is there anything you would recommend changing, adding or removing?
How did you learn about our website?
Which category would you fit into as a user? (ESH gruppa employee, designer, student, teacher, entrepreneur, manager, artist, other.)
So, if you have a promotional or portfolio website, don't overlook these areas, and we hope you see the difference in your website's success.
For our website to remain profitable, it was designed with a lifespan of 5–7 years. But as our studio evolves, so will our goals and branding. When the time comes, we'll consider redesigning to keep our online presence relevant.
In the meantime, we make it a priority to track these metrics consistently not just in the first year, but throughout our website's lifecycle. We believe that this data-driven approach is key to making our website stay an asset, not a liability, useful and engaging to both us and our customers.

